Chapter 11 Road to (Assignment) Submission
The purpose of this chapter is to provide guidance and a checklist of tasks that are recommended for planning and writing the Psychological Measurement Portfolio.
Please note that it is not exhaustive, and just represents the minimum needed to pass.
Your final grade will be based on the following: - How well you have engaged with the course, including directed and independent learning, - the breadth and depth of your understanding, - and the professionalism of the final submission.
For more information, please see both the Learning Objectives for the module, and the University’s Graduate Outcomes.
11.1 General
The following points apply to the whole portfolio:
Follow APA-7th edition formatting! This includes citations, references, tables, and numerical information. If you read something in this document that conflicts with APA-7th formatting then follow this document. For instance, you cannot submit an article in OpenDyslexic font, but you can submit your assignment using this font! The APA Style Guide can be accessed here: (Link to APA-7th Guide)
Please do not use serif fonts such as Times New Roman (see Figure 11.1) Use sans serif fonts such as 11-point Calibri, 11-point Arial, or 10-point Lucida Sans Unicode. If you wish, you may use the OpenDyslexic font (Link to OpenDyslexic font)
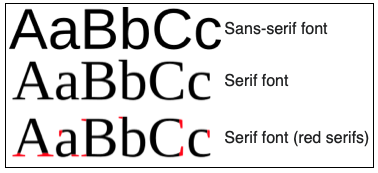
Figure 11.1: Examples of Serif and Sans-Serif fonts.
Please don’t use double spacing. This is from when feedback would be given manually with a pen. Using 1.5 spacing is easier to read, leads to smaller documents, and means my scrolling finger doesn’t get sore when marking.
Section numbering is optional.
In line with APA formatting, indent the first line of every paragraph with a Tab.
The portfolio must be written in British or American Standard Written English (Link to page on standard English).
The portfolio must be proof-read for spelling and grammar errors - this is meant to immitate a professional document!
You may use Co-Pilot to do this - but include the original in the appendix.Use Level 1 headings as a minimum. You may use additional levels of sub-headings if you wish, but do not exceed three levels unless absolutely necessary (it probably wont be). See the Misc chapter (Link to What do you mean by sub-heading levels?)
11.2 Short Glossary
Construct: Psychological attribute that is being explored.
Percentile: A type of standard score that gives the percentage of people who scored below a particular value (Link to Chapter on standard scores, Link to extended discussion of percentiles).
Raw Score: The score that the Test Taker got on the test. This could be:
The be number of correct answers on an intelligence test (e.g. 27 out of 30),
or the average response to a set of personality questions (e.g. 3.5 out of 5) (Link to Misc section on Raw scores), .
Standard Score: A score that presents the Test Takers Raw score in the context of a norm group.
Test: The method of quantifying a construct. Can also be called a measure, tool, etc.
Test User: The person who will administer the test to the Test Taker.
Test Taker: The person who will sit down and provide answers to the questionnaires.
11.3 Part 1 - The Technical Manual
Starting Points
In Part 1 you are responding to one of the two case studies (Link to Scenarios) and providing a solution to the problem that has been provided.
The first step is to carefully read the chosen case study and identify key words that imply the involvement of psychological constructs. For a guide to doing this see Week 4’s workshop materials (Link to Week 4 Workshop video).
Once you have identified potential constructs of interest from the case study, you should choose at least 2 (no more than 4) and find an appropriate measure from the ones that have been provided in the assessment materials (Link to list of measures).
A measure can either be an aggregate (e.g. Full Scale Intelligence), or a sub-scale (e.g. Verbal intelligence), and you can mix and match between measures. For example:
| Measure 1 | Measure 2 |
|---|---|
| ICAR Full Scale IQ | GAD7 |
| ICAR Verbal IQ | ICAR Spatial IQ |
| ICAR Spatial IQ | AQ10 |
| etc | etc |
What do you Mean by Boundary Condition?
In Week 4 I mentioned Boundary conditions and this has caused a little confusion.
There may be a particular policy that you can find indicating that people with a particular attribute (e.g. General Learning Disability) are eligible for a different type of treatment such as a targeted programme tailored for this group of people.
If this is the case, and scoring above or below a score on a gold standard psychometric test is part of the diagnostic criteria, then you can discuss this as a boundary or cut-off score when discussing the appropriateness of the construct (not the test).
However, you must be clear that the screening test is not intended for diagnostic purposes. For a more in-depth discussion see the following link (Link to technical discussion of boundaries).
Introduction Section
After choosing the measures that you will use to assess the constructs of interest, you will write an introduction section that presents the constructs and measures you have chosen. This will involve finding and summarising evidence to support the existence of the construct (see Week 2 playlist and materials on construct validation (Link to Week 2 Playlist), evidence for the reliability and validity of the measures that you have chosen (see Week 4 materials (Link to Week 4 Playlist).
In addition, you should try to find literature that has used the construct (and ideally the measure) in a forensic (Scenario 1) or occupational (Scenario 2) setting. Starter papers have been provided for each measure, so you could search for these using Google Scholar or Web of Science, click on ‘cited by’, and search within the citing articles for key words such as ‘forensic’.
Finally, you should discuss what unique information each measure will contribute towards the profile. For instance if you have chosen Agreeableness and Honesty from the HEXACO, how do these scales complement each other?
This will form the introduction section of the manual.
Method Section
You will then write a method section that provides important information about the measures that you have chosen and the norm group that the test taker will be compared with.
Norm Group Characteristics (i.e. Participants section)
This will include the characteristics of the participants for each measure that makes up the norm group.
Demographic information can be found in the individual datasets, and details about how the data were collected can be found either in the data directory (Scenario 2) or from Wilson & Bishop’s stage 2 manuscript.
For those of you who are doing Scenario 1, if you have never heard of a Registered Report before, see the following link: (Link to Registered Report Misc section).
You should also provide how the participants were accessed, and the approximate date that the data was collected - even if this is just the year.
Materials and Administration Instructions (i.e. Materials and Procedure)
This should contain everything that the test-user needs in order to successfully administer and score the test.
It must include the following: - The number of items in each scale, - The number of scale points (e.g. how many different Likert statements there are), - an indication of which items need to be reversed (if any), - the scoring method for the scale (e.g. should they add up all of the responses, or take the mean average), - What a high score or low on the measure indicates.
This information will be available from the starter papers that were bundled with the scenario descriptions and datasets. Links to these can be found on this site: (Link to Assignment Materials section on the Twisted Pear).
You might also consider how the test user should administer the battery. Have you been instructed to use a particular medium? Is the test timed? Do you need exam-like conditions? It’s unlikely that information like this will be available, so you can create your own insqtructions based on the scenario.
Psychometric Properties (i.e. Results Section)
You will provide the Psychometric Properties for each scale. This section should only describe the norm group. The Test Taker from Section 2 is not relelvant in Part 1.
You will use Jamovi to produce tables for reliabilities, means, standard deviations, and percentiles
(Link to Embedded Jamovi How-to Video).
Once you have completed the Jamovi tasks, refer to the data record sheet and the generic scoring template to get the Classical Test Theory parameters (this was covered in Week 5 – (Link to Week 5 playlist)): - Raw score standard error of measurement, - T score standard error of measurement, - T score standard error of difference.
For a short summary of these issues refer to Chapter 4 (Link to chapter on reliability).
In the Portfolio Template there is a suggested ‘validity’ heading in the Psychometric Properties section. This is optional, but could be useful.
For instance, if you are arguing that Intolerance of Uncertainty is a useful screening measure because it reflects anxiety, but only in specific situations, you could provide correlations between IUS and GAD to demonstrate that the two constructs are related, but that IUS also provides unique information about an individual that is not captured by GAD-7. If a correlation is high, but not too high, (e.g. 0.4-0.6) this might indicate that there is convergent validity between the two measures, but they are also contributing something unique to the profile. If the correlation is very high (e.g. above 0.9) then you are measuring very similar constructs, and you might as well just use one of the measures.
11.3.1 Checklist for Part 1
Note that the following is a guide and simply represents the minimum to include. You will be marked on how you present this information, and how you justify your decisions, and show that you have understood the course content and met learning outcomes. This will be down to you
| Section | Task | Done |
|---|---|---|
| Prelims | Choose Scenario | |
| Identify keywords | ||
| Select construct | ||
| Selected measures | ||
| Reviewed literature | ||
| Introduction | General introduction | |
| Introduce each construct | ||
| Discuss construct validity of each | ||
| Introduce each measure | ||
| Present reliability and validity evidence | ||
| Discuss the profile | ||
| Method | Described norm group | |
| Described materials and administration | ||
| Results | Calculated norm group characteristics | |
| Checked reliability of the measures | ||
| Calculated Classical Test theory parameters |
11.3.1.0.1 Advanced Options
In Part 1 you may include anything from the course materials and beyond to demonstrate that you have read around the topic.
| Example Optional Extras |
|---|
| Exploratory or confirmatory factor analysis, |
| Discussion of assumption checks for things like normality, unidimensionality, or Tau Equivalence, |
| Discriminant Item Functioning or other IRT parameters, |
| Convergent or divergent validity evidence. |
These are advanced concepts and should not be included unless you have fully understood their relevance and can confidently discuss them.
11.4 Part 2 - Sample Feedback
In Part 2 you will present a sample feedback report for a fictitious person who has completed your measures. This is not a specific person from the institution, rather it is a template that one of the staff at HMP Birley or Birley House would base their own report on.
Starting Points
First you will use the norm group data that you prepared in Part 1 to fill out the remaining rows in the Data Record Sheet. The first row will be the Test Takers score on the test.
You have been given four z scores – these need to be converted to the scale that your measures are on. Select one z score for each of the measures that you have chosen. You can convert the z score to a Raw score using the following equation:
\[ RawScore = (NormSD \times zScore) + NormMean \]
So for a z score of 1.8, a Raw norm group mean of 2.5, and a Raw norm group standard deviation of 1.2 you would get the following:
\[ RawScore = (1.8 \times 1.2) + 2.5 \]
Once you solve this equation with your own numbers you will have the Raw (Test Taker’s) scores that you will write up and interpret in Part 2.
Now you can use the rest of the information from the results table to complete the remaining:
The percentile equivalent of this score (use the percentile table to get this information)
The confidence interval around this score (use the Standard Error of Measurement to calculate this).
The confidence interval around their percentile score (use the percentile table to get this information).
Their T-Score
The 68% Confidence interval around their T score
Plot the 68% Confidence interval to get the range that the test-taker is in (see Portfolio template)
It is recommended that you append a complete set of calculations (e.g. Test Data Record Sheet).
11.4.0.1 Should I mention Boundary Conditions?
Remember that the purpose of this screening tool is to provide one source of information that will aid the organisations decision to:
Scenario 2 Assign inmate to adapted rehabilitation Shortlist applicant for interview Assign inmate to ordinary rehabilitation Reject application
The tool is not for diagnostic purposes. You, as the psychometrics consultant, are not the one making the decision. You are simply providing the means to obtain additional evidence to support a decision.
So in terms of the feedback report, you will not be using diagnostic criteria as a boundary value (e.g. a score of x is indicative of…).
Rather, any statements will be based on the range that their score is in relative to the norm group, and presented in terms of a typical profile (people who are in the high to highest range for this measure are more likely to…).
The Report
The report should be written in clear, accessible language that a person who is unfamilliar with psychometrics, or even psychological more broadly, can understand. Some examples of the type of language used to give feedback is given in Chapter 8 (Link to Test Feedback Guidance Chapter). The report should be concise (imagine that someone has to sift through over 70 of these) and professionally presented. A checklist for the things to include in Part 2 can be found in the Portfolio template document but is reproduced below.
11.4.0.2 Checklist for Part 2
| Item | |
|---|---|
| 1 | Do you introduce yourself and/or the organisation? |
| 2 | Do you remind the reader of the purposes of the report? |
| 3 | Do you introduce each measure and briefly describe how and when each was administered? |
| 4 | Do you give a brief description of the construct each tool measures before describing the score for each test? |
| 5 | Do you give a rationale and justification for the use of each measure before describing the score for each test? |
| 6 | Do you explain clearly the nature of norm group comparison and their relevant characteristics? |
| 7 | Do you describe the meaning of the scale (e.g. percentiles) or scales (e.g. percentiles and T scores) accurately and in terms which the test taker could understand? |
| 8 | Do you communicate clearly and accurately the score for each measure? |
| 9 | Do you communicate clearly and accurately the confidence limits associated with each score? |
| 10 | Are any statements implications (e.g. risk,) supported by background information for the test (e.g. validity)? |
| 11 | Do you communicate clearly and accurately any score comparisons made across the measures taken? |
| 12 | Do you give clear guidance as to the appropriate weight to be put on the findings (e.g. such tests are only one source of information)? |
| 13 | Have you briefly mentioned any ethical guidelines associated with the report? |
| 14 | Do you give clear closure to the feedback report? |
| 15 | Have you appended the record sheet and interval plots |
11.5 Part 3 - Critical Reflection
In the final part of the portfolio you will discuss some of the limitations to your battery which should be considered prior to wider usage.
You may write this as a report (formal, passive, third-person), or as a letter to the stakeholder (formal, second person perspective).
The reflection will include evidence-based examples of relevant aspects of the battery (e.g. constructs or scales, statistical methods, or norm group) that may bias the results, interpretations, and decisions made whilst using it. It should also include suggestions for alternative measures, or aspects that might be changed in order to make the battery more fair (Link to Chapter on test bias and fairness).
You may wish to include a more technical critique to show that you have understood the limitations of e.g. using alpha reliability, Classical Test Theory, etc and considered alternatives (Link to Item Response Theory Video), (Link to very brief description of Generalisability Theory).
This is also where you will include any major limitations to the measures that you may have encountered during your literature review. For example, in Part 1 you would focus on the strengths of using a particular measure over another, and in Part 3 you would focus on the limitations of using that same measure. If you feel that any of the measures are adequate, you could also suggest follow-up tests that might be used after screening.
The whole section must be evidence-based with relevant citations from good quality sources.
| Item | Done |
|---|---|
| Identified sources of bias | |
| Established the relevance | |
| Found supporting evidence. | |
| Considered alternatives. |
11.6 Appendix
Checklist for Appendix
The Jamovi output and Data Record Sheet calculations are requested so that I can see what happened in the event that something goes wrong. The plot of the 68% confidence intervals and Pre-Co-Pilot draft are required.
| Item | Attached |
|---|---|
| Jamovi Output | |
| Data record sheet with calculations | |
| Plot of 68% Confidence intervals | |
| Pre-Co-Pilot Draft |